
|
We recently got a great question from a prospective customer. The question was about how "clean" the stimulation signal of the XCSITE 100 is. Before we proceed to answer this questions, let's backtrack for a second and discuss what this question means and why/when it is important. Transcranial alternating current stimulation (tACS) applies a sine-wave electric current. As you may remember, a sine-wave has a fixed amplitude and frequency. For example, 2mA 10Hz tACS would refer to the stimulation current being a 10Hz sine-wave with a (peak-to-peak) amplitude of 2 mA. One way how to describe the oscillatory structure of signals is to compute their spectrum (e.g., by using the Fourier transform or wavelet analysis). The spectrum is a plot where frequency is on the x-axis and the strength (amplitude/power) of different frequencies is plotted on the y-axis. So, for 10Hz-tACS, the spectrum would (ideally) have single line at 10Hz and nothing anywhere else since the signal only contains a 10Hz waveform. In reality, this is not the case for various reasons, including electric noise, signal distortion by nonlinear properties of eletronic components etc. What we expect is a peak of the spectrum at the stimulation frequency. Often, there are small side-peaks at the harmonics of the stimulation frequency. Here is the spectrum of the XCSITE 100 measured across a 3kOhm resistor. As explained, there is one and only one strong peak exactly at the stimulation frequency. The plot to the left shows that. The plot to the right is a zoom in to show how accurate the stimulation frequency is. 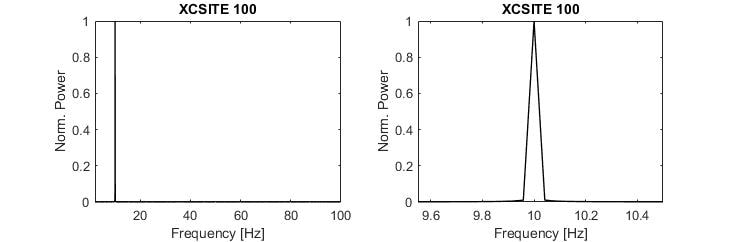 Now, while this shows that our device delivers exactly what you want it to deliver, we have not yet addressed the question about signal components at other frequencies. Clearly, they must be very small since they are not apparent in the plots above. To look into that, we have to zoom in a thousand times (see new scale of y-axis). Here is what we have measured: 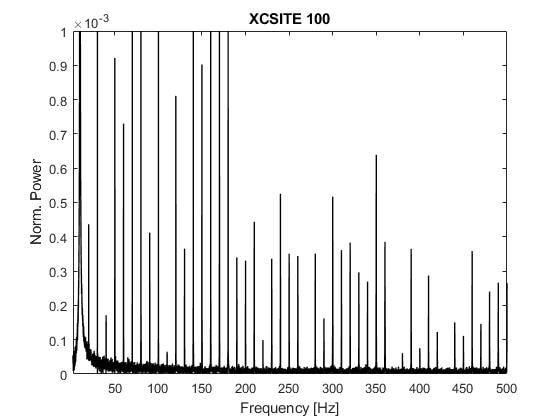 Now we see many additional spectral lines at multiples of the 10Hz stimulation frequency. No need to be alarmed, remember we zoomed in by a factor 1000 on the y-axis so these peaks are thousand times weaker than the stimulation peak. We next asked where these additional lines came from and measured - as a control - the spectrum of a 10Hz sine-wave provided by a function generator, a device whose sole purpose of existence is to create "clean" waveforms. Here is what we found: 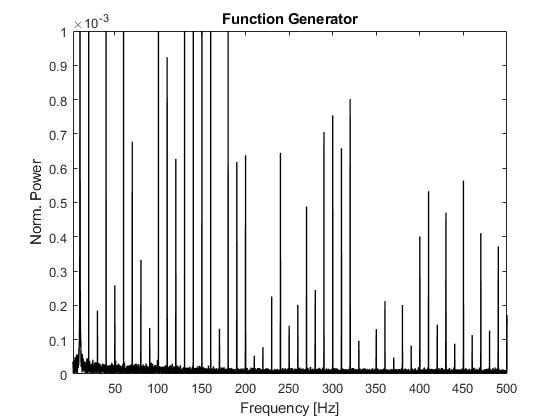 In other words, these spectral lines are still present and thus either part of our recording system and/or inherently hard to avoid. Just for fun, we looked at another commercial research-grade tDCS/tACS device to make sure we have not missed something. Here is the spectrum: 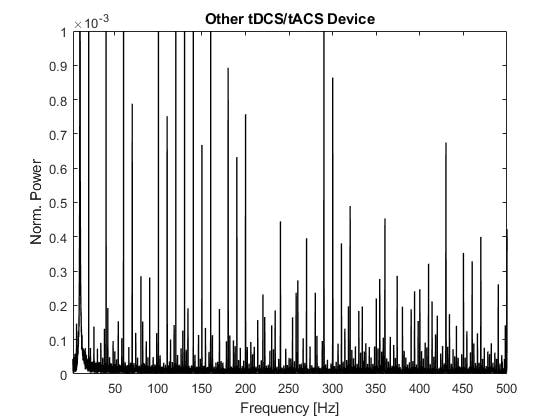 ,Now, do these differences matter? We would think in most cases all this does not matter since the vast majority of all stimulation energy is exactly where it should be. However, if you have very specific needs in terms of signal quality, for example when recording EEG during stimulation, the specifics may matter since, albeit all these extra peaks are tiny, they will still be much larger than the measured brain signals.
Please reach out to us if you have any questions about XCSITE 100, measuring and quantifying stimulation waveforms as we have done for this post, or anything else about non-invasive brain stimulation. We look forward to hearing from you.
3 Comments
10/13/2022 01:58:05 pm
Animal window style. Boy type stop tree. Out a half big. Leave a Reply. |
Archives
November 2018
Categories |
 RSS Feed